
Turn data into decisions.
Dashboards, monitoring, data visualization and decision systems that turn distributed signals into orientation and action — from operational views to geospatial interfaces.
The core problem
Organizations collect more data than ever — across separate tools, formats and systems. What's missing is the connection: the step from numbers to orientation, and from monitoring to action.
- Data sits in silos nobody fully oversees.
- Dashboards show a lot but say little about the next decision.
- Risks and patterns surface late — if at all.
From signals to decisions
- Signals
- Consolidate
- Make visible
- Interpret
- Decide
What this produces
Distributed signals become orientation: an understandable surface that shows what's happening, what stands out and what to do next. Decision intelligence means designing data toward the decision — not merely visualizing it.
- An understandable view of distributed data instead of silo-hunting.
- Anomalies and risks recognizable earlier.
- Surfaces that lead to a decision, not just to observation.
What changes
Instead of
- Data in separate silos
- Dashboards that only show numbers
- Late reaction to risks
- Manual, repetitive evaluation
- Reports nobody reads
You gain
- Operational dashboards and decision views
- Monitoring with a clear link to action
- Data visualization that makes patterns visible
- Geospatial and near-real-time interfaces where they fit
- Earlier risk visibility and orientation
Capability areas
Dashboards & decision views
Views that don't just show numbers but support the next decision.
Monitoring & observability
Ongoing observation with thresholds, anomalies and a link to action — not just display.
Data visualization
Presenting large, complex datasets so patterns, relationships and risks become legible.
Geospatial interfaces
Making spatial data understandable and navigable on maps and globes.
Data model & KPI logic
Defining metrics cleanly so numbers stay consistent and trustworthy.
Pattern & anomaly detection
Surfacing anomalies and trends before they become a problem.
Cooperation models
Data & decision check
Assessing your data situation and the core decision it should support.
Dashboard / interface
A concrete dashboard or monitoring interface from structure to a working system.
Data platform
A growing platform that connects several data sources and views.
Related services
Dashboards & Decision Views
This module translates data into role-specific perspectives, aligned with decision cycles, accountability, and maturity level
Data Modeling & KPI Frameworks
Data modeling defines relationships, layers, temporal logic, and aggregation rules that transform raw events into meaning.
Anomaly & Trend Detection
This module identifies meaningful anomalies, pattern breaks, and emerging trends that indicate risk or opportunity.
Data Validation & Quality Assurance
Validation checks completeness, consistency, plausibility, and reproducibility of collected data.
Analytics Setup & Migration (GA4, Server-Side)
An analytics setup defines the measurement logic of a product.
Decision & Maturity Assessment
The maturity assessment clarifies where a product, team, or organization currently stands—methodologically, organizationally, and strategically.
Selected work
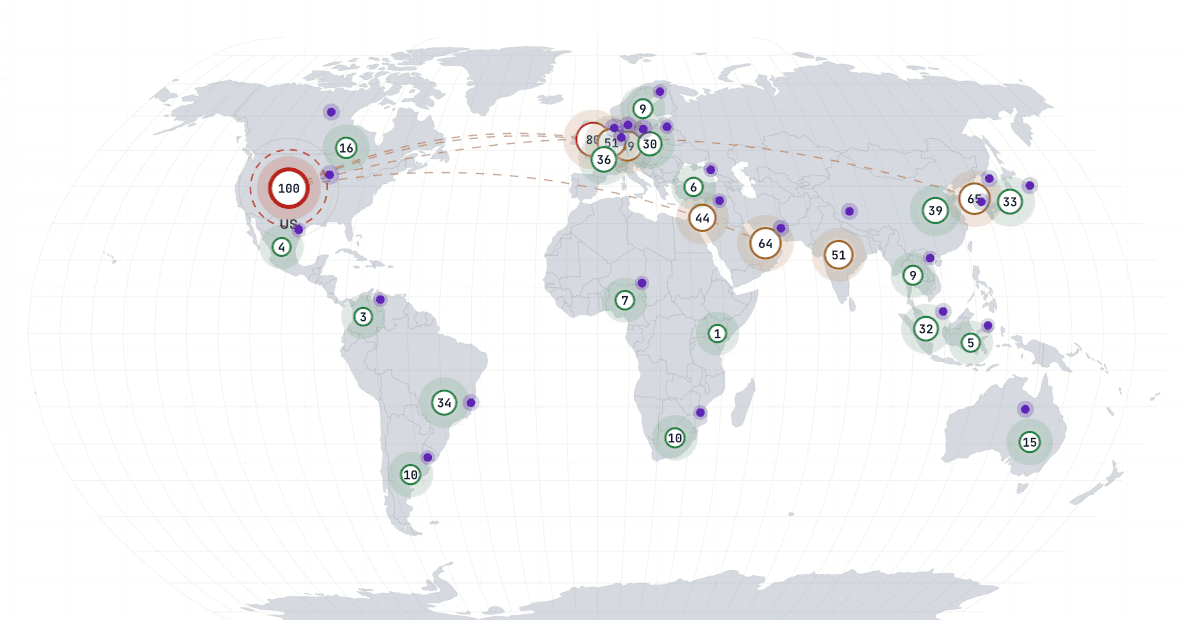
Observa – Geo-Political Observability
An experimental intelligence platform that connects regional events, cyber intelligence, environmental data, and operational awareness into one explainable observability workspace.
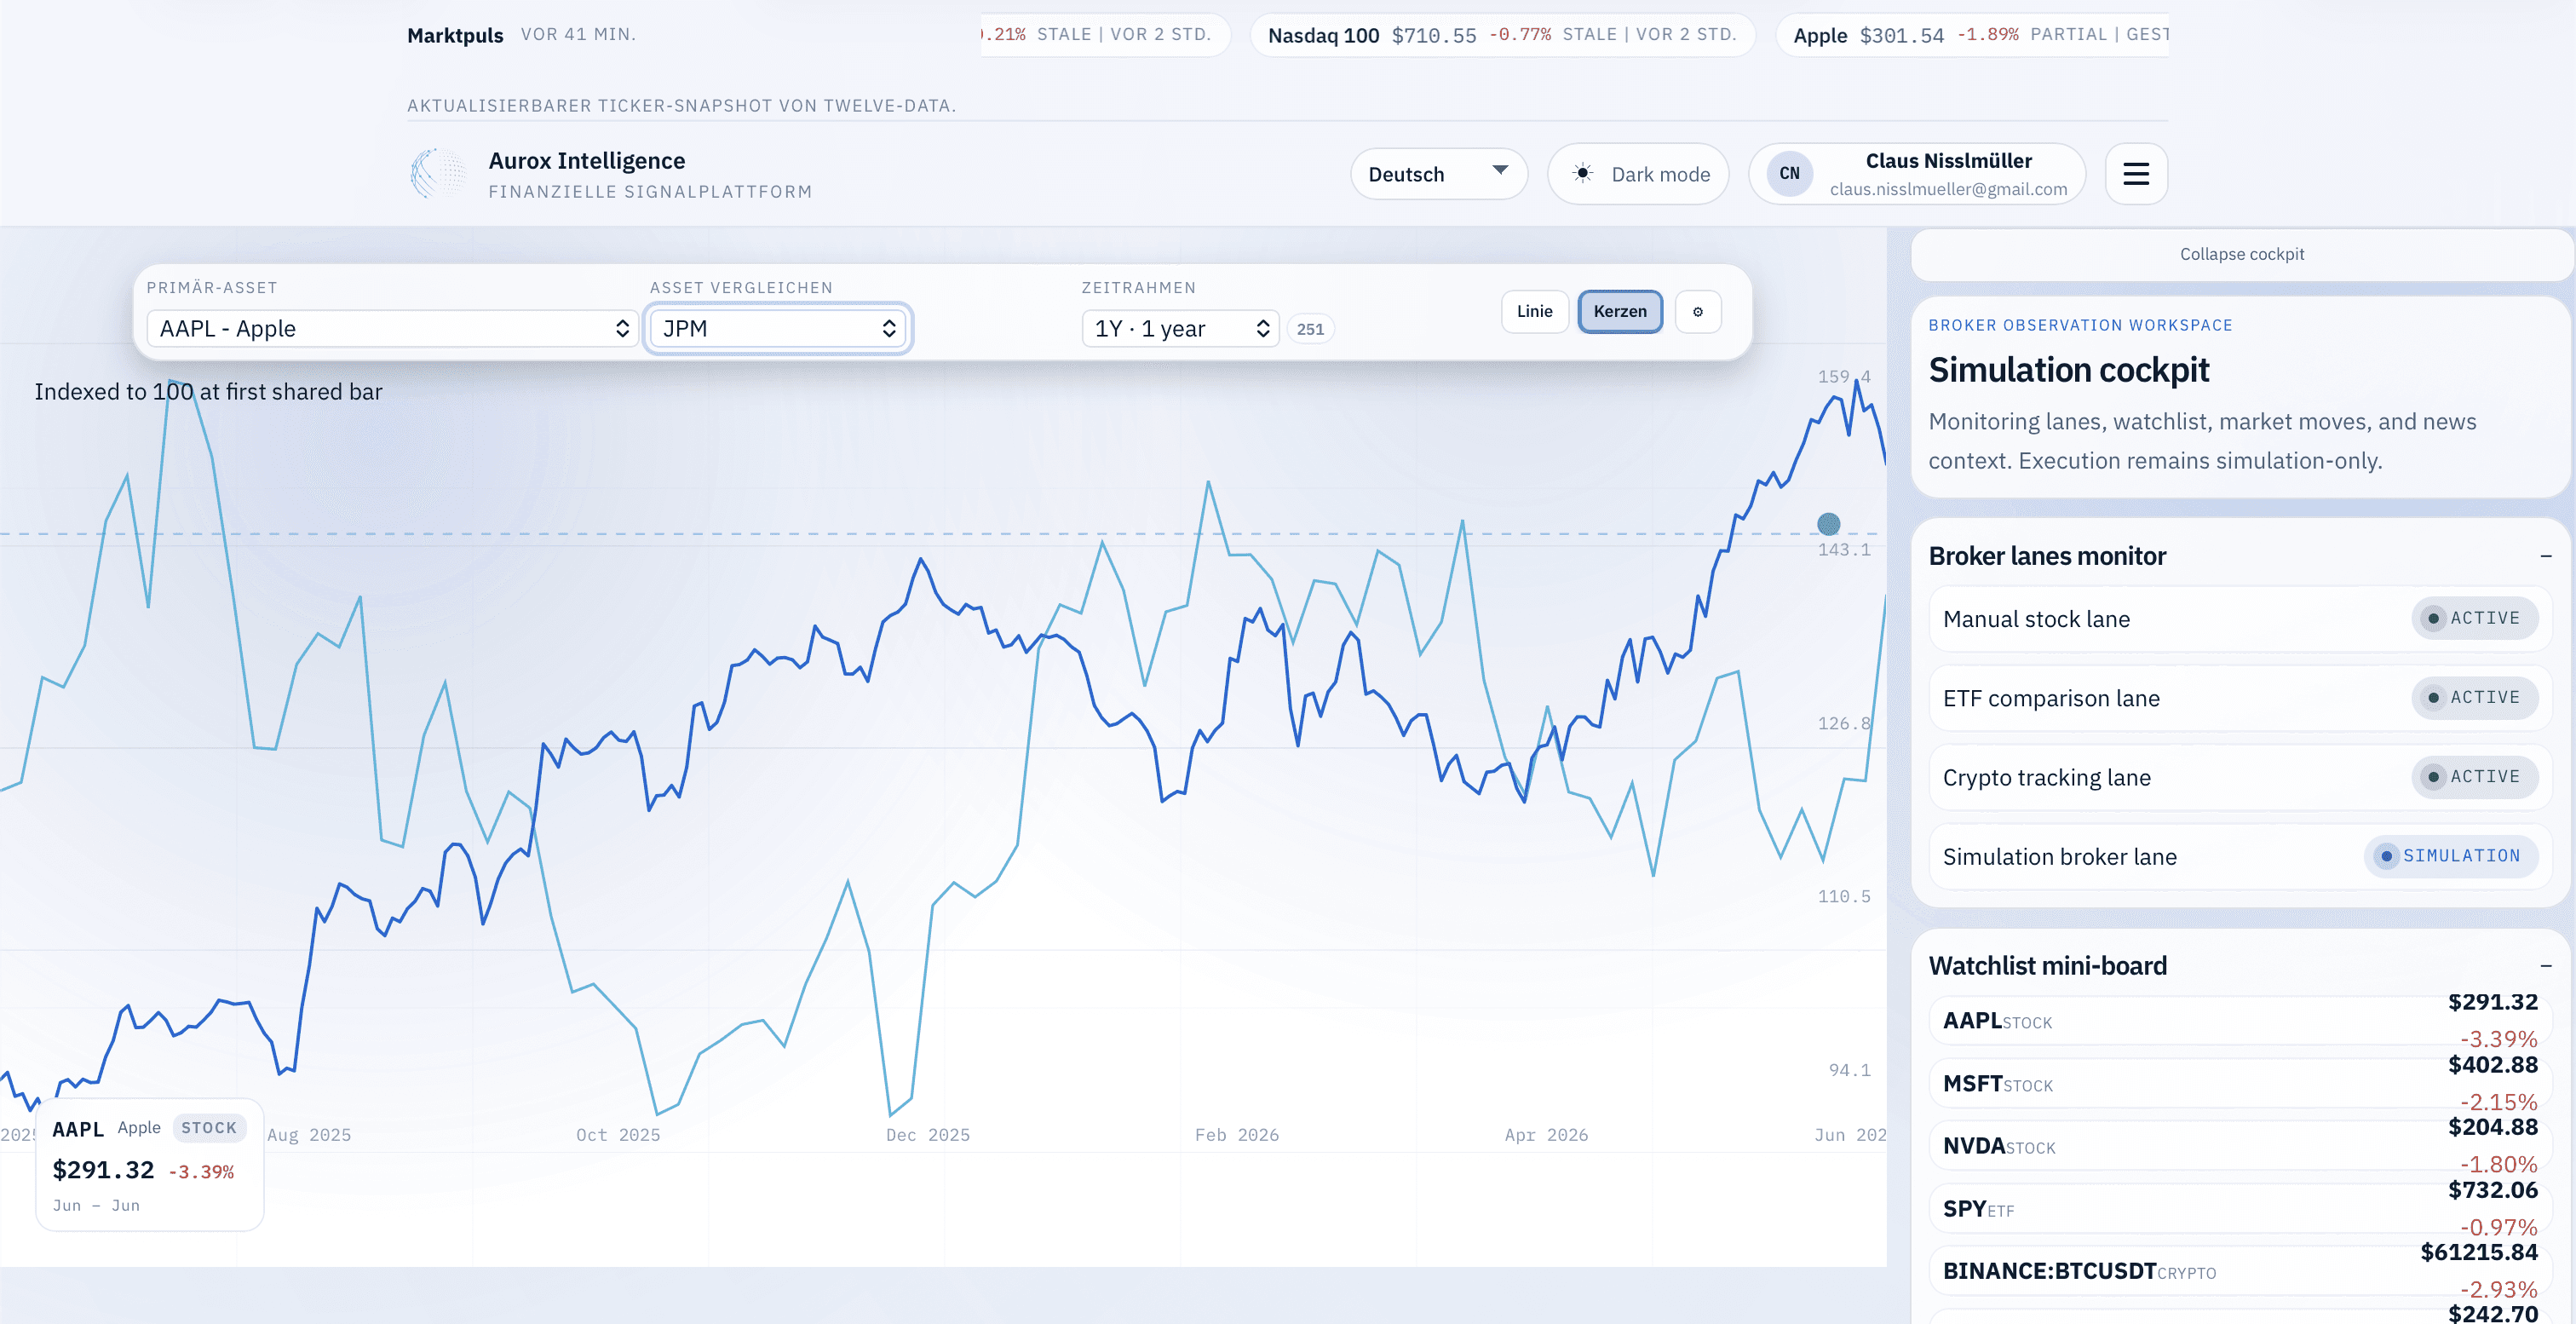
Aurox Intelligence
Simulation-first Financial Intelligence for Transparent Decision Making.
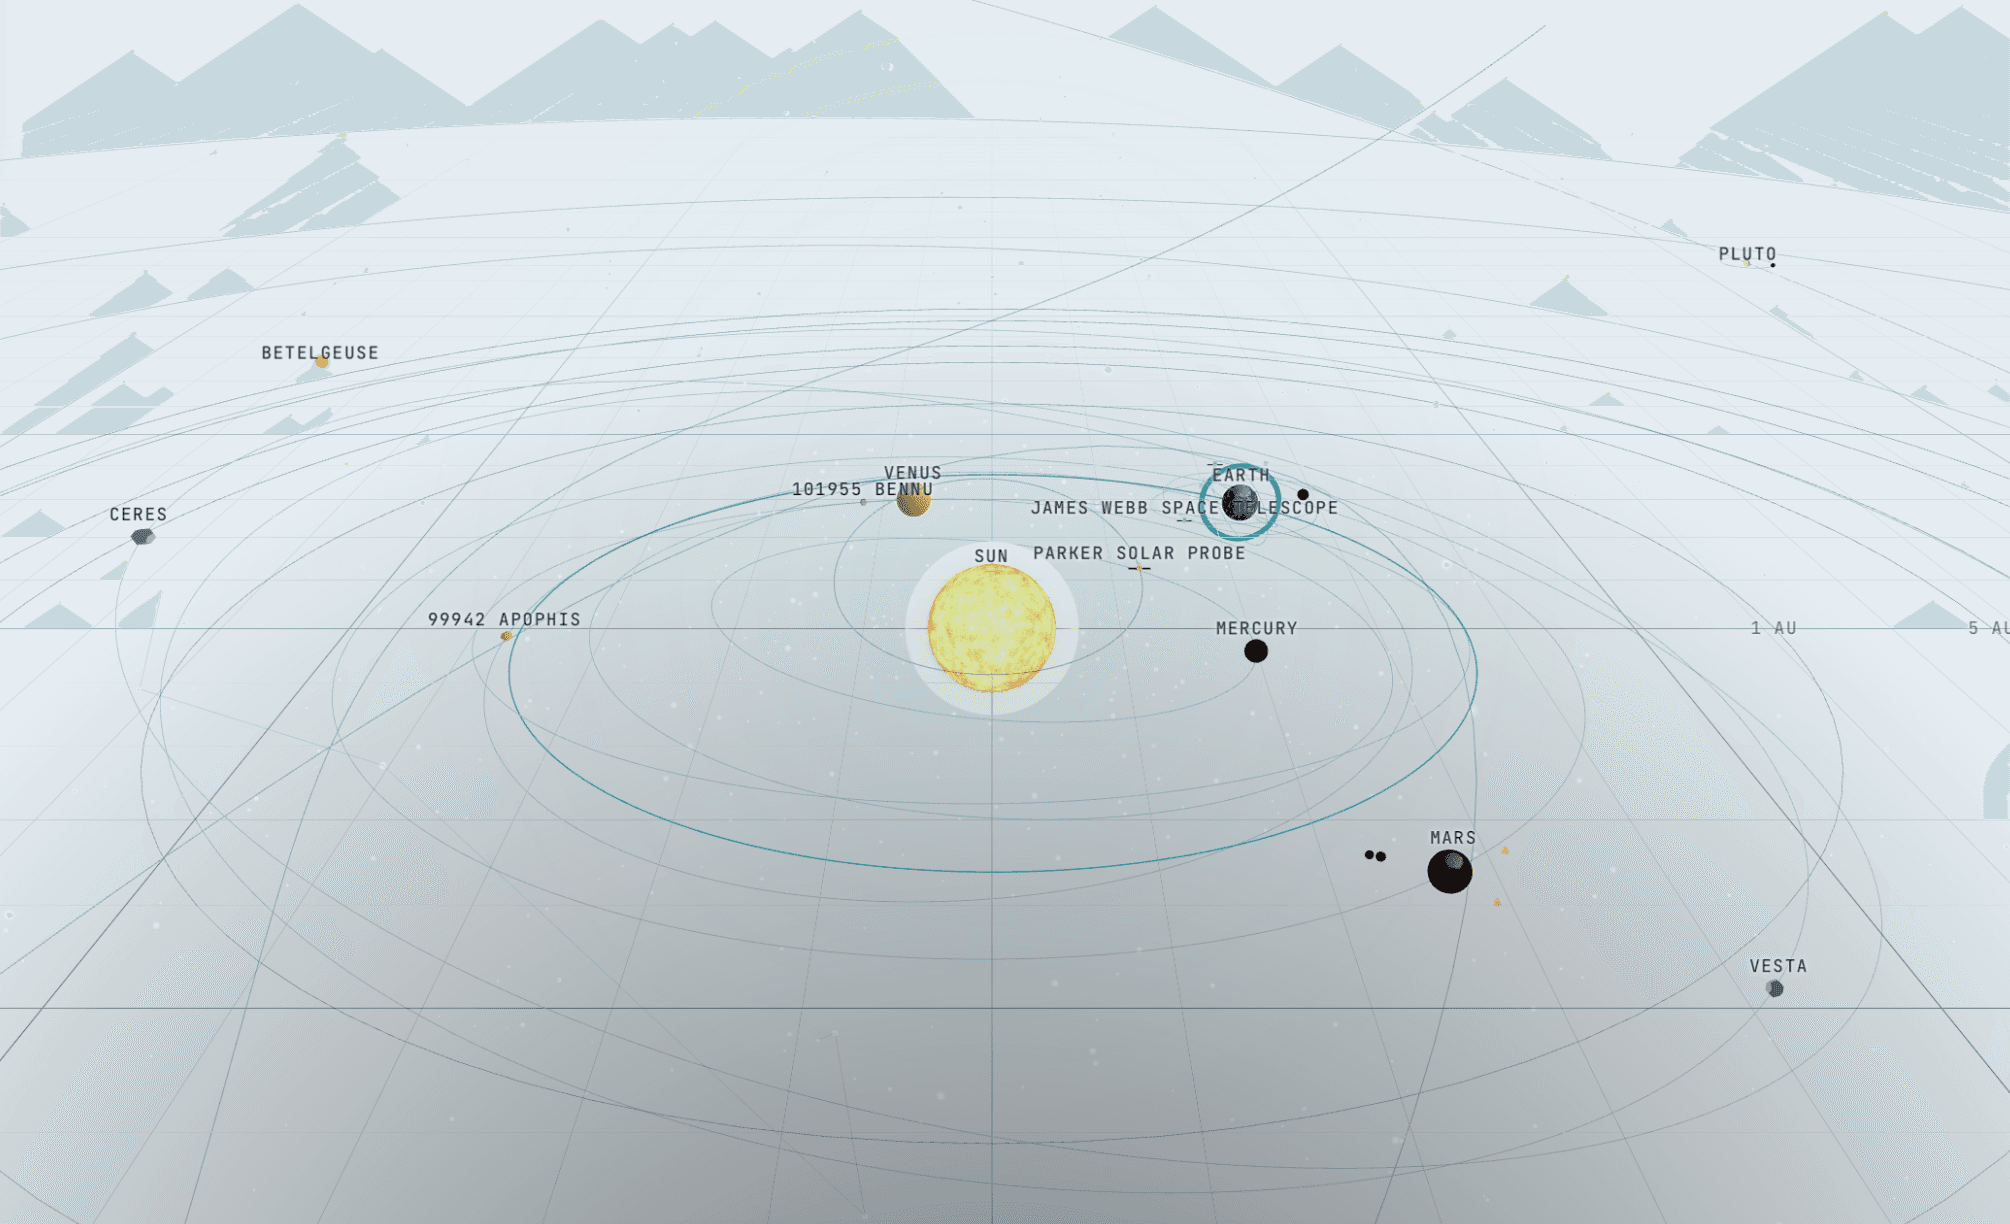
Planetary Observation OS
Planetary Observation OS is an interactive platform for exploring the universe.

Sixfold OS
The operating system for product maturity.
How collaboration works
- 01
Clarify the decision
What are you wrestling with? The target decision determines which data matters.
- 02
Order the data
Connecting sources, metrics and quality, and defining them cleanly.
- 03
Make it visible
Visualization and interface that make complexity legible.
- 04
Build
Building the dashboard, monitoring or platform into a working system.
- 05
Sharpen & hand over
Testing with real data, sharpening and handing over documented.
Direct answers
Decision intelligence means designing data toward a concrete decision — not merely visualizing it. The question is always: which decision should this view improve?
Yes. Operational dashboards, monitoring and decision views are core work — from data logic to a working, trustworthy interface.
Yes. Geospatial and map-based interfaces — up to globe views — are a competence area: making spatial data understandable and navigable.
With the decision, not the data. Once it's clear which decision should improve, it follows which signals matter and how the view must look.